Clustering Illusion — Meaning, Examples & How to Overcome It
Mind · Cognitive Biases · Probability & Randomness family
Test yourself — can you spot the bias in each scenario? Take the Cognitive Bias Spotter Test. Jump to the test ↓
What Is the Clustering Illusion? Simple Definition
The clustering illusion is the tendency to perceive meaningful patterns, streaks, or clusters in data that is actually random. When random events are distributed across time or space, they naturally produce clumps and streaks — and the human mind, built to find patterns, interprets these as evidence of a non-random underlying cause.
In plain terms: randomness does not look the way people expect it to. Random sequences contain more consecutive repetitions and more apparent clusters than intuition predicts. When these natural features of randomness are encountered, the mind concludes that something non-random must be producing them — generating false patterns where none exist.
This page is part of the cognitive biases guide on our free brain training and assessment tools, alongside interactive apps covering memory, attention, reaction time, and decision-making.
Clustering Illusion Meaning & Psychology
The clustering illusion was identified by psychologist Thomas Gilovich and named in his 1991 book on the fallibility of human reasoning, drawing on earlier foundational research by Kahneman and Tversky. Kahneman & Tversky (1972) showed that the bias is driven by the representativeness heuristic — the tendency to judge whether a sequence is random by comparing it to a mental prototype of what randomness should look like. That prototype is wrong in a consistent direction: people expect random sequences to alternate more frequently and produce fewer streaks than genuine randomness actually generates.
The result is that genuinely random sequences look non-random to most observers. When a coin lands heads four times in a row, this feels improbable — yet in any sequence of twenty flips, the probability of at least one run of four consecutive heads is over 50%. The streak is not evidence of a biased coin; it is simply what random sequences look like.
The hot hand fallacy
The clustering illusion is most famous in the context of the hot hand fallacy — the widespread belief that athletes go through genuine hot and cold streaks that predict future performance. The foundational study by Gilovich, Vallone & Tversky (1985) analysed the shooting records of the Philadelphia 76ers and found no statistically significant positive correlation between consecutive shots — a player who had just made several shots in a row was not meaningfully more likely to make the next one. The apparent streaks in shooting performance were consistent with random variation. Players, coaches, and fans unanimously believed the hot hand existed; the data did not support it.
The hot hand debate has continued, with subsequent research producing more nuanced findings about specific contexts. But the core insight of the original study holds: the streaks people observe in sequential performance data are far more consistent with random variation than observers typically recognise.
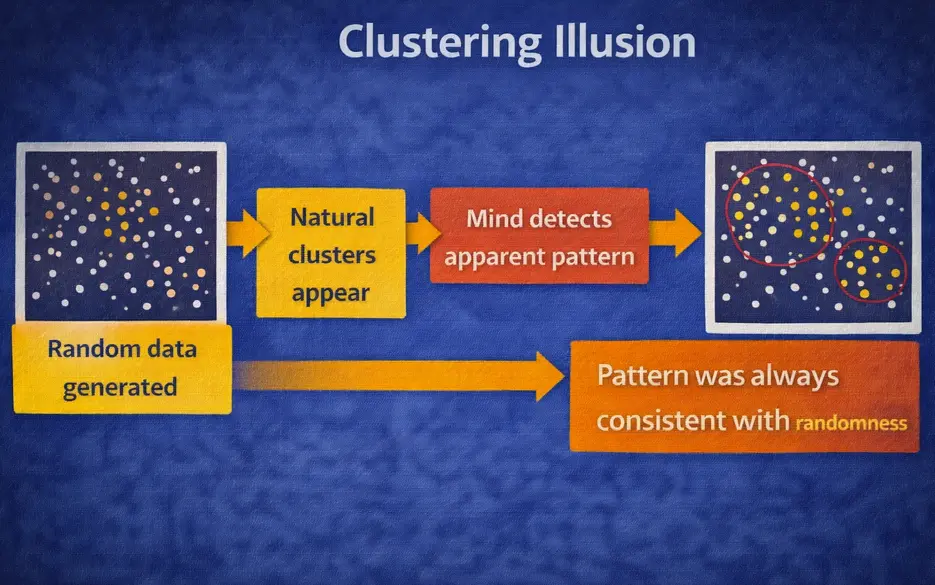
The clustering illusion: random data naturally produces clusters, the mind detects an apparent pattern — but the pattern was always consistent with randomness.
Clustering Illusion in Real Life — Examples
One of the most striking historical examples of the clustering illusion involved the bombing of London during World War II. German V-1 and V-2 rockets fell on London in a distribution that appeared to Londoners to show clear patterns — certain areas seemed to be targeted deliberately, while others seemed to be avoided. Specific theories developed about why particular neighbourhoods were being hit. A statistical analysis published in 1946 showed that the distribution of impacts was an extremely close fit to a purely random Poisson distribution. The apparent clustering was the clustering illusion; the rockets were simply falling randomly.
Cancer clusters provide another vivid example. When an area reports a higher-than-average rate of a particular cancer, residents and media often conclude that an environmental cause must be responsible — a factory, a power line, a chemical. Epidemiologists are careful to note that in any sufficiently large geographic area, some regions will have higher-than-average cancer rates purely by chance, in the same way that some coin-flip sequences will contain more heads than tails. The appearance of a cluster does not by itself establish a non-random cause, and many publicised cancer clusters have not been confirmed by rigorous investigation.
Clustering Illusion in Investing and Finance
Financial markets are a major domain for the clustering illusion. Stock price movements, fund performance, and economic indicators all produce sequences of data that the human pattern-detection system actively mines for meaningful structure. When a fund manager outperforms the market for three or four consecutive years, observers tend to conclude that the performance reflects genuine skill rather than random variation — even though, in a large population of fund managers, some will produce multi-year streaks of above-average performance purely by chance.
This connects directly to survivorship bias: the fund managers who are most visible are those who have produced the longest streaks of good performance. The fund managers who produced similar or longer streaks of poor performance have closed their funds and disappeared from the sample. The remaining visible streaks of success feel like evidence of skill partly because the counterfactual streaks of failure are invisible.
Technical analysis in stock trading is substantially built on the clustering illusion — the identification of patterns in price charts (head-and-shoulders, double tops, support and resistance levels) that are presumed to predict future price movements. While the academic debate about technical analysis is not settled, a significant portion of the patterns identified in price data are consistent with what would be expected from random walks, and the clustering illusion provides a powerful psychological explanation for why these patterns appear meaningful to experienced observers.
Clustering Illusion in Science and Medicine
The clustering illusion is a recognised problem in the interpretation of scientific data, particularly in fields that analyse spatial or temporal distributions of events. Medical researchers, epidemiologists, and public health officials routinely encounter apparent clusters — of disease cases, adverse events, or treatment failures — that trigger investigation but ultimately turn out to be consistent with random variation.
In psychology and social science, the clustering illusion contributes to the problem of false positives in small-sample research. When a small sample produces a striking pattern — a cluster of participants who all respond in the same direction — this can appear to be strong evidence of an effect when it is actually within the range of random variation expected from small samples. Confirmation bias compounds this: researchers who expect to find a pattern are more likely to notice and publish the apparent clusters that support it.
Clustering Illusion in Sport and Performance
Beyond basketball, the clustering illusion shapes how performance is interpreted across virtually every sport. Batters in baseball are described as being "in the zone" or "ice cold"; tennis players are said to be "serving well today" or "struggling"; golfers are described as having "found their putting stroke." In many of these cases, the perceived streaks are consistent with random variation in performance — the natural clumping that random sequences produce — rather than genuine temporary elevations or depressions in underlying ability.
This does not mean that performance never varies meaningfully — fatigue, injury, confidence, and external conditions genuinely affect performance in ways that produce real non-random patterns. The clustering illusion warns against the automatic assumption that any observed streak reflects a real underlying change in state, when it may simply be what random variation looks like over short time periods.
How to Avoid and Overcome the Clustering Illusion
Expect randomness to be clumpy
The most fundamental correction for the clustering illusion is to update the mental model of what randomness looks like. Genuine randomness produces streaks, clusters, and apparent patterns more frequently than intuition predicts. When you notice a streak or cluster in data, the first question should not be "what is causing this pattern?" but "is this streak consistent with what random variation would produce?" In most everyday cases, the answer is yes.
Demand statistical tests before concluding non-randomness
The clustering illusion is a failure of intuitive pattern detection, and the correction is formal statistical analysis rather than visual inspection. Whether a cluster of events in space or time is genuinely non-random can be tested — using tools such as the Poisson distribution for spatial data, or runs tests for sequential data. Visual inspection of sequences reliably produces false pattern detection; statistical analysis does not.
Increase sample size before drawing conclusions
Apparent patterns in small samples are the most susceptible to the clustering illusion, because small samples produce the most striking deviations from expected proportions by chance. Three consecutive successes in five attempts looks like a streak; three consecutive successes in five hundred attempts is unremarkable. Before concluding that a pattern in data reflects a real underlying structure, ask whether the sample is large enough to distinguish genuine non-randomness from the clusters that random variation routinely produces. This connects directly to the insight from gambler's fallacy research: short sequences are genuinely unrepresentative of the long-run distribution they are drawn from.
The Deeper Point
The clustering illusion reflects the same core feature of cognition that makes the gambler's fallacy and neglect of probability so persistent: the mind is not built to reason intuitively about randomness. Pattern detection is one of the brain's most powerful and useful capabilities — the ability to find structure in noisy data has enormous adaptive value. But this same capability, applied to genuinely random sequences, reliably produces false positives. The pattern-detection system does not have an off switch for randomness; it finds patterns whether they are there or not.
The consequences extend from the mundane to the consequential. False patterns in personal experience produce superstitions — lucky routines, unlucky numbers, rituals that "work." False patterns in medical data produce health scares that divert resources from genuine risks. False patterns in financial data produce investment strategies built on illusory edges. In each case, the clustering illusion is doing the same thing: generating a compelling sense of structure where the data is consistent with chance.
Related biases that interact closely with this one: the gambler's fallacy, which shares the same root misunderstanding of randomness but generates expectation of reversal rather than continuation; confirmation bias, which selectively attends to the data points that support the perceived pattern; and availability heuristic, which makes memorable clusters feel more representative of a pattern than isolated events.
The Cognitive Bias Spotter Test below puts that understanding to work — see if you can identify the clustering illusion and the other nine biases when they appear in realistic scenarios.