Mach Bands Illusion
The gradient changes smoothly, but narrow bands may appear where the rate of brightness change begins and ends.
Look across the image from left to right. It begins with a flat dark region, gradually becomes lighter through the middle, and ends with a flat light region.
Near the two places where the gradient meets the flat areas, you may see something extra: a narrow dark band near the darker transition and a narrow bright band near the lighter one.
Those bands were not drawn into the image. The central brightness increases at one perfectly constant rate, with no sudden dip, peak, shadow, or highlight.

This is the Mach Bands illusion, a brightness effect in which the visual system exaggerates changes near the boundaries of a luminance gradient.
The effect reveals how strongly vision prioritizes edges and changes instead of recording absolute brightness independently at every location.
What Is Physically Present?
The left section has one constant dark-gray value. The right section has one constant light-gray value.
Between them, the pixel value rises in a straight line. Each vertical column is only slightly brighter than the one before it.
The important locations are the two places where the rate of change shifts. At the first, the image changes from flat darkness to a gradual increase. At the second, the increase stops and becomes flat lightness.
The apparent bands tend to form around those changes in slope. The darker side appears slightly darker than its physical value, while the lighter side appears slightly brighter.
The Proof: There Are No Brightness Spikes
The proof image marks the two transition locations with gold lines. The chart underneath shows the exact luminance profile used to construct the image.
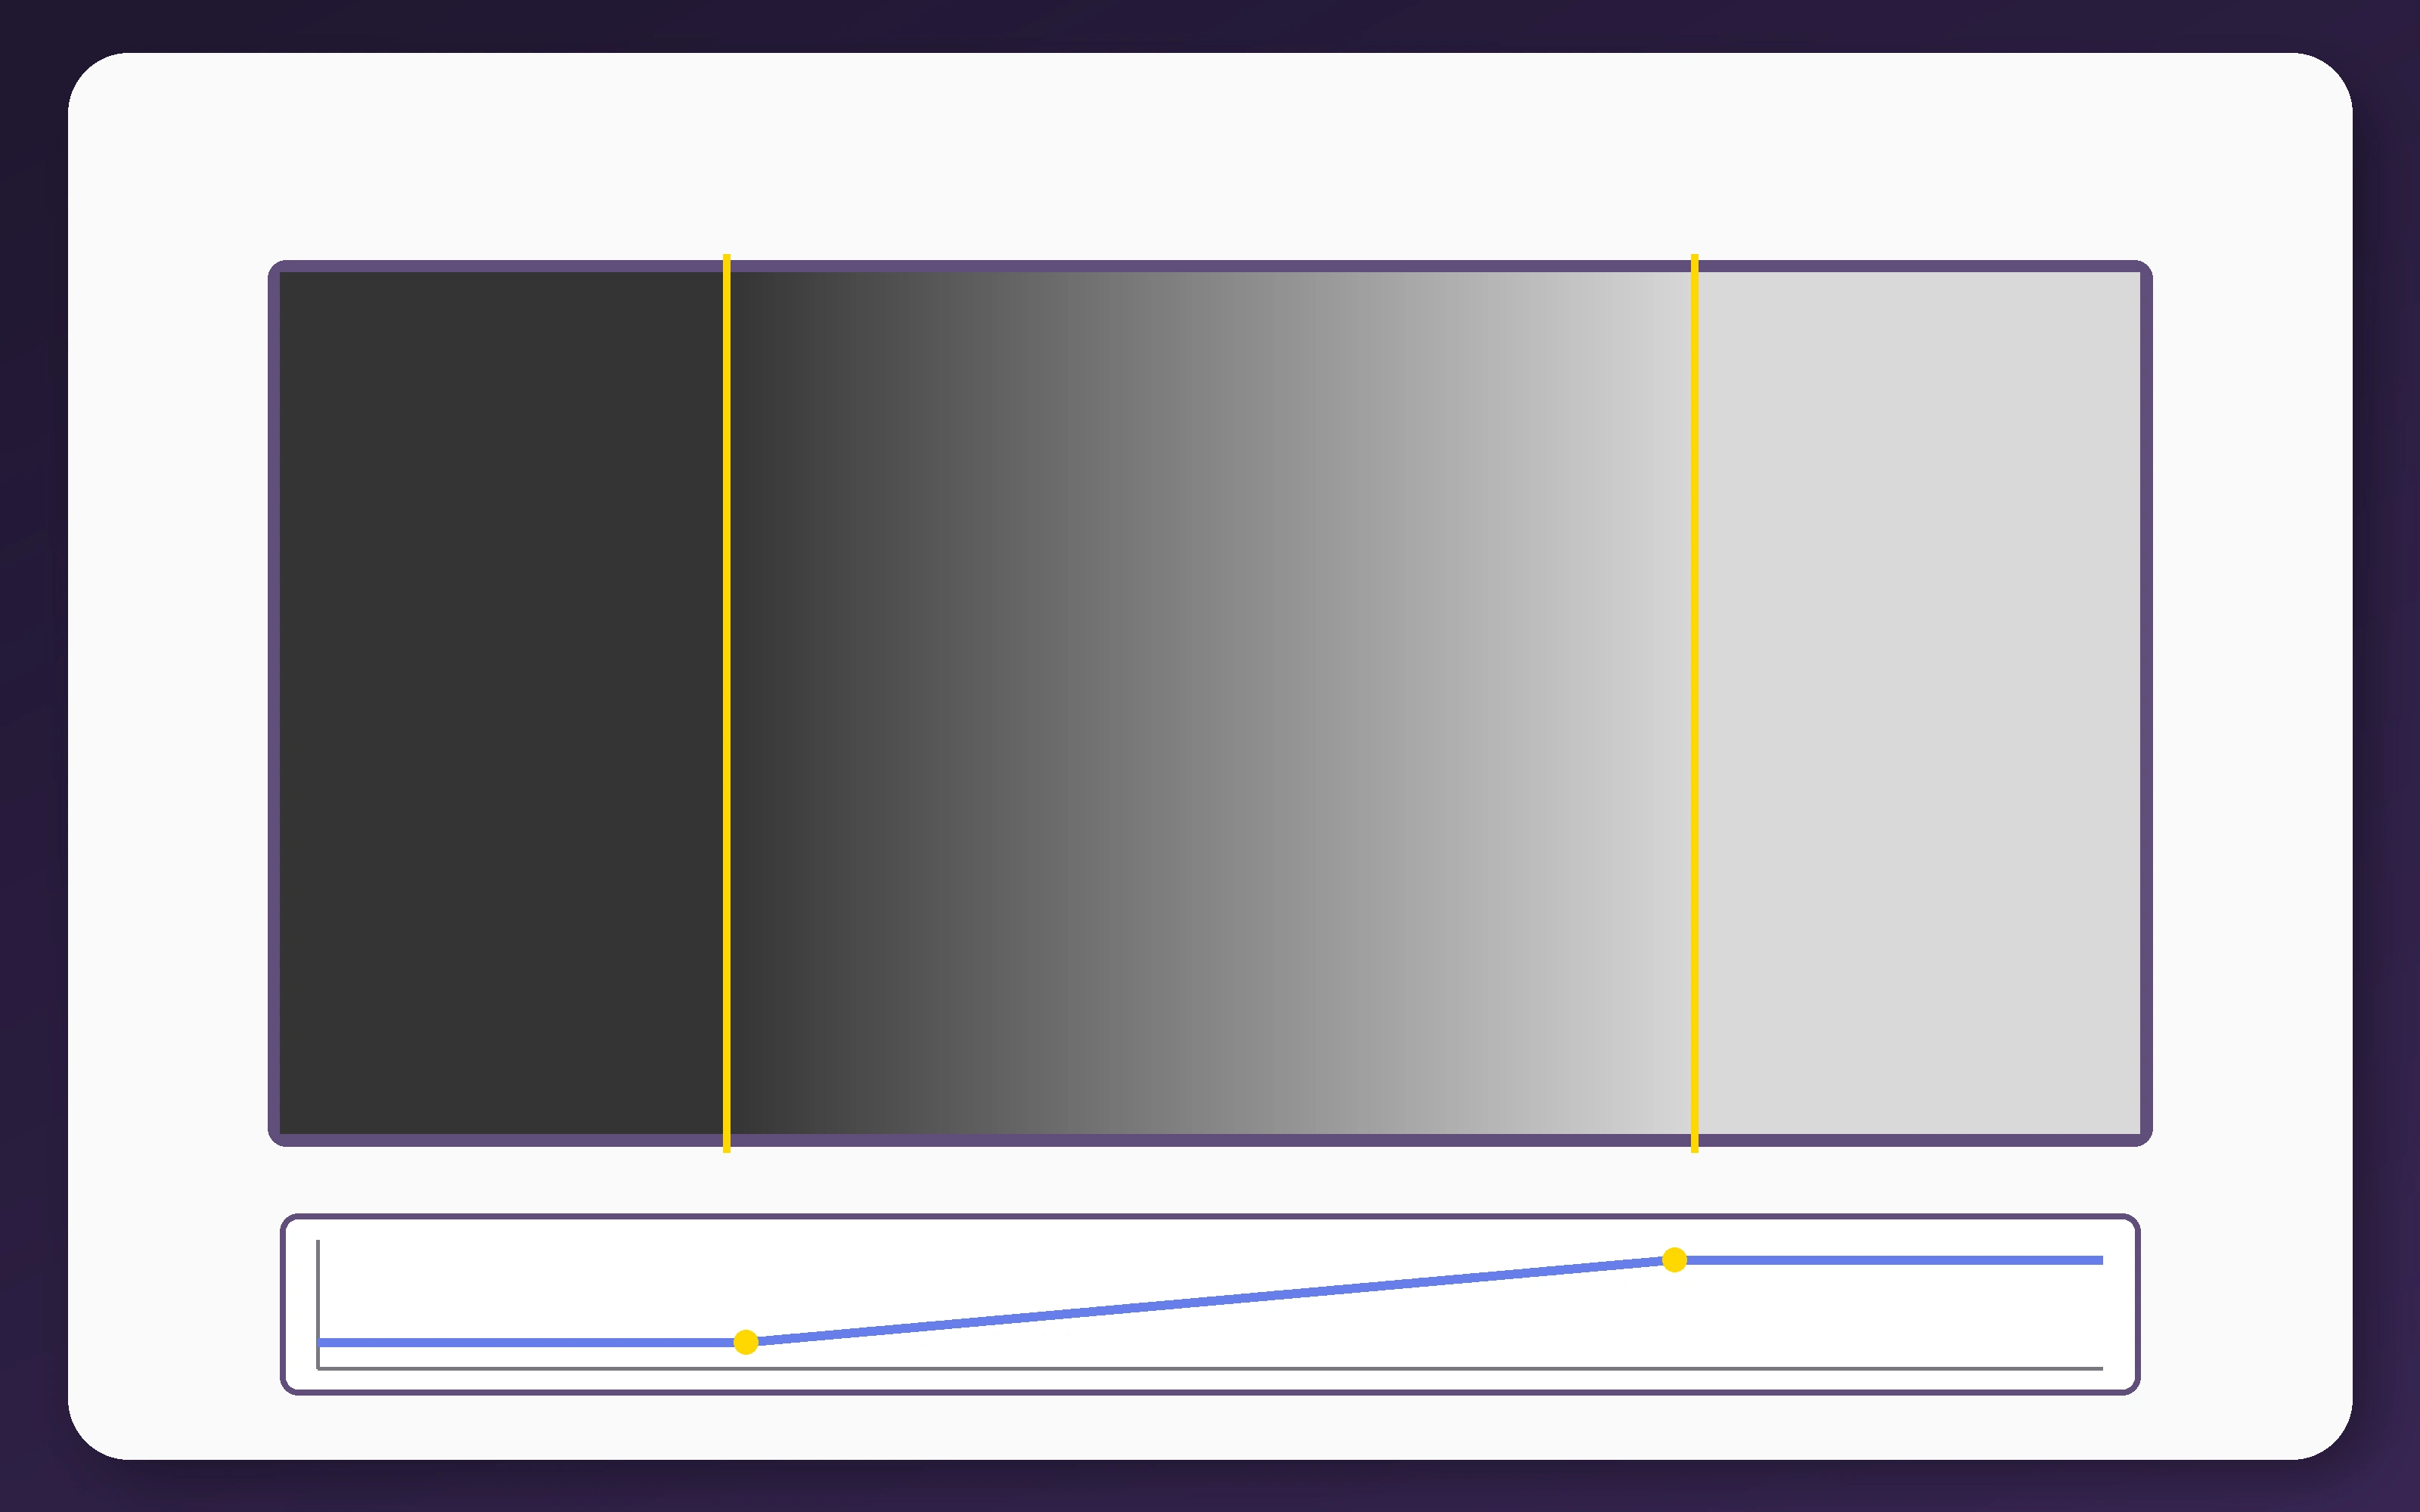
If real bands had been inserted, the chart would show an upward spike near the light end and a downward spike near the dark end. It shows neither.
The extra contrast exists in the visual experience, not in the source data.
The Classical Explanation: Lateral Inhibition
Mach Bands are commonly explained through lateral inhibition.
Retinal neurons do not respond only to light falling on one tiny location. Many have center-surround receptive fields in which stimulation in one area affects responses to nearby areas.
A strongly stimulated region can suppress neighboring responses. This interaction helps emphasize boundaries and small differences across space.
Near the brighter end of the gradient, a location receives different surrounding input from the darker region beside it. Its response may become exaggerated, contributing to an apparent bright band. The reverse relationship near the darker end can contribute to an apparent dark band.
A review of lateral interactions in the outer retina explains how surround inhibition supports edge detection and can produce Mach-band-like responses.
Related edge and brightness interactions also appear in the White’s Illusion, although its direction cannot be explained by simple local contrast alone.
Why Lateral Inhibition Is Not the Whole Answer
The classical account is useful, but it cannot predict every condition under which people see Mach Bands.
In a 1989 study by John Ross and colleagues, visibility depended on factors including the shape and extent of the luminance distribution.
Some patterns that should have produced a suitable inhibitory response did not create clear perceptual bands. Additional visual processes therefore influence whether local activity becomes a consciously visible edge.
Frederick Kingdom later proposed a response-normalization account. In this model, the visual system represents important bars and edges efficiently rather than reconstructing every luminance value literally.
Mach Bands can emerge when part of the gradient is represented as an edge-like or bar-like feature.
Nearby Objects Can Weaken the Bands
The apparent bands are influenced by surrounding structure rather than being determined only by the gradient itself.
In experiments by Floyd Ratliff and colleagues, adding nearby vertical stimuli weakened the Mach Bands. The closer those objects were to the gradient transition, the greater the attenuation tended to be.
A purely local calculation based only on the ramp would not easily predict that change. Neighboring contours and perceptual organization also affect the final appearance.
This separates Mach Bands from the Hermann Grid Illusion and Scintillating Grid Illusion, which depend on repeated intersections and peripheral viewing rather than a change in gradient slope.
Try a Related Contrast Test
Mach Bands exaggerate contrast near changes in brightness. Contrast sensitivity asks how small a real brightness difference can become before a target fades into its background.
Could Experience Shape the Illusion?
Another explanation asks what luminance gradients normally mean in the natural world.
Gradients frequently occur on curved surfaces. As a surface turns toward or away from a light source, its brightness changes gradually. Highlights and darker regions often appear near places where the surface orientation changes.
In research on an empirical basis for Mach Bands, Beau Lotto, Suzanne Williams, and Dale Purves examined how similar luminance patterns relate to real-world surface geometry.
They proposed that the visual system interprets ambiguous gradients according to statistical relationships learned from previous visual experience.
Under that account, the apparent highlight and lowlight reflect what comparable gradients have often indicated about surfaces and illumination.
Where Mach Bands Came From
The illusion is named after Austrian physicist and philosopher Ernst Mach.
Mach investigated the effect systematically in 1865 while studying how the spatial distribution of light affects visual sensation.
A historical summary and interactive demonstration are available through Michael Bach’s Mach Bands page.
How It Differs From the Checker Shadow Illusion
Mach Bands and the Checker Shadow Illusion both change perceived brightness, but they use different visual information.
Mach Bands arise around changes in a simple luminance gradient. They require no recognizable objects or realistic lighting scene.
The Checker Shadow illusion depends on scene interpretation. A checkerboard, cylinder, and plausible cast shadow cause the visual system to discount illumination and estimate the underlying surface reflectance.
Mach Bands emphasize gradient transitions and edge processing. Checker Shadow emphasizes lighting context and lightness constancy.
What It All Comes Down To
The Mach Bands illusion places a linear brightness gradient between two flat regions.
The image contains no narrow highlight or shadow, yet the visual system can exaggerate the changes in slope and create apparent bright and dark bands.
The effect is classically linked to lateral inhibition, but normalization, nearby contours, perceptual organization, and learned relationships between gradients and surfaces may also contribute.
For more examples of brightness, color, motion, and geometric distortions, browse the full Optical Illusions guide. Cognitive Train’s brain tests explore perception, attention, processing speed, and reasoning, while its free brain training tools offer more ways to challenge visual processing.